Value and growth are the two most traditional schools of investing. Value investors seek to find companies that they believe are undervalued. Growth investors seek companies offering capital or earnings growth that they believe will outperform the market. Since the Global Financial Crisis (GFC), growth stocks have generally outperformed value stocks, due to macroeconomic factors. This outperformance has been exaggerated during the COVID-19 sell-off to a more extreme point than ever. However, given the right macroeconomic conditions, a rotation of growth to value is to be expected. This cyclical bounce in value could happen in the short term, with value bounces lasting for an average of 3-4 months.
Here we lay out the 4 macroeconomic conditions needed for this rotation to occur and the relative impacts each may have. In terms of portfolio construction, it is important to consider the best way to ‘play value’. Historically, this has involved a move from the US to UK and from more defensive, to more cyclical sectors.
Macroeconomic structural forces have driven growth’s outperformance of value, a relationship that recently has come to its most extreme. Since the GFC, 4 macro variables can be used to explain the relative outperformance: oil prices, manufacturing Purchasing Managers Index (PMI), the strength of the dollar and US 10-year 3-month yield spreads. As structural forces, they have put pressure on financial companies, seen the value of the dollar rise, the commodity super cycle fade and bond yields depress; creating a poor environment for value.
The significance of these factors is clear when comparing an ‘estimated index’, based off these variables, to the actual index of value over growth . This displays an overwhelming correlation of 90.46%. Essentially, most of the outperformance of growth has resided from the effect of these 4 factors. As these macroeconomic conditions have changed since 2008, a general trend of value underperformance has emerged.
The recent market sell-off has left the performance gap between growth and value at its most extreme. What was considered ‘value’ has now become ‘deep value’, simply look at the impact on retail stocks.
Whilst the ‘growth’ stocks have become even growthier, predominately US tech stocks. This can be seen from a valuation perspective, with the gap between the two styles at an all-time high. Since 2000, the MSCI Value to Growth relative P/E ratio has been 0.7, it is currently at 0.45, an all-time low (see chart 1). In other words, value stocks have never been this ‘cheap’. With this dichotomy more prevalent than ever and value ‘bounces’ notoriously short and sharp, the question of how the next may look arises.
Chart 1: Value stocks have never been this ‘cheap’
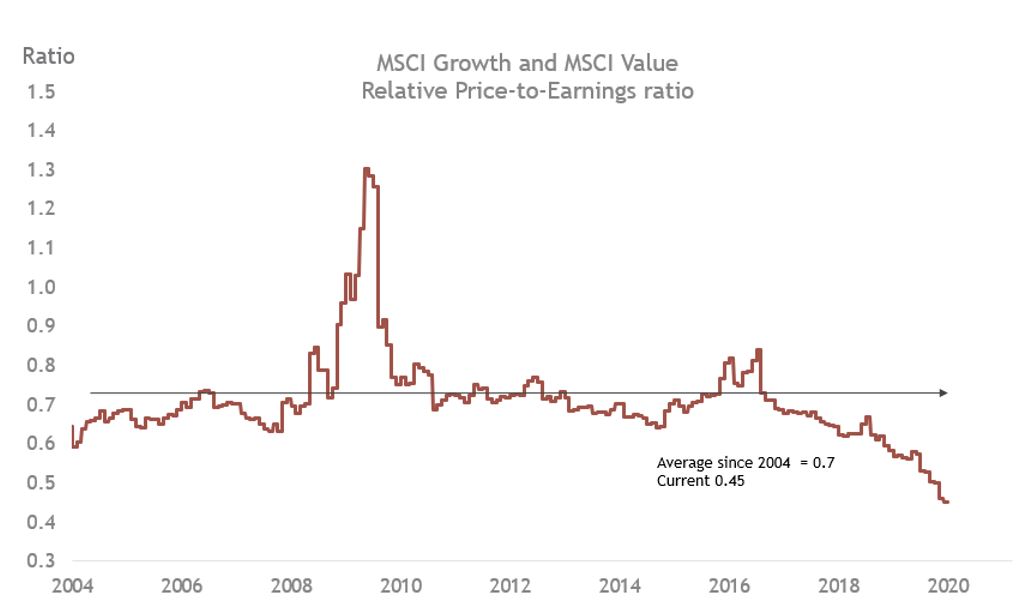
Source: Datastream/Smith & Williamson Investment management 03/06/2020
Given that our 4 macroeconomic factors remain as influential as they have been over the last decade, the macro outlook supports a cyclical bounce in value. The relative performances and valuations discussed above are not in themselves enough to dissuade from the possibility of a ‘value trap’. Rather, in V-shaped recovery scenario (a real GDP growth trajectory), we see the macro factors catalysing the rotation to value.
Firstly, oil prices have been stabilising due to supply and demand rebalances. Supply cuts have led this stabilisation, notably from the US and OPEC. Provided the global economy is about to reopen, demand will pick up, which should only add to this rebalancing and increase oil prices.
Secondly, global manufacturing PMI, which is essentially a proxy for global manufacturing growth, is recovering. China, as the first economy to reopen after lockdowns, exemplifies this, whilst European exporters are stabilising too. As supply chains mend, demand for commodities further improves and with possible further fiscal stimulus, global PMI should continue to rise.
Thirdly, a decline in the strength of the dollar, which is largely dependent on a pick-up in global manufacturing PMI. USD is currently strong, having seen nominal broad USD rise 10% in Q1 2020, thanks to its safe-haven status . However, as dollars start to trickle back into the global economy, the dollar will weaken.
Finally, a cyclical rebound in inflation. US 10-year 3-month yield spreads indicate a sharpening of the yield curve, which supports this. As demand returns over the next 3-6 months, short term deflation is a real possibility, however over the mid-long term, we see a likelihood of cyclical inflation. Given the outlook for these 4 conditions and their capacity to work concurrently, they should provide a supportive backdrop for a rotation from growth into value.
Analysis of previous value outperformance periods indicate the best ways of ‘playing value’, both for geographies and sectors. This has been touched upon above and chart 2 provides more colour. From a georgical perspective a clear rotation from US to the UK can be seen. In a value environment, UK and Europe are the clear winners, whilst the US lags. Currently P/E ratios in the US are giving far higher valuations in comparison to the UK. This gives weight to the idea of a hard and fast rotation, given the exaggerated gap. From a sector perspective, clear winners and losers appear. Energy, financials, industrials, materials and real estate have consistently outperformed in a value environment. Again, their P/E ratios, when compared to other ‘growth’ sectors, are remarkably lower. For example, financials are trading at 9.5x, whilst IT at 27.3x . Given the right macro conditions and an outperformance of value, investors should look to adapt their portfolio accordingly. A rotation from US to UK and non-cyclicals to cyclicals, could reap attractive returns.
Chart 2: Best historic ‘value plays’
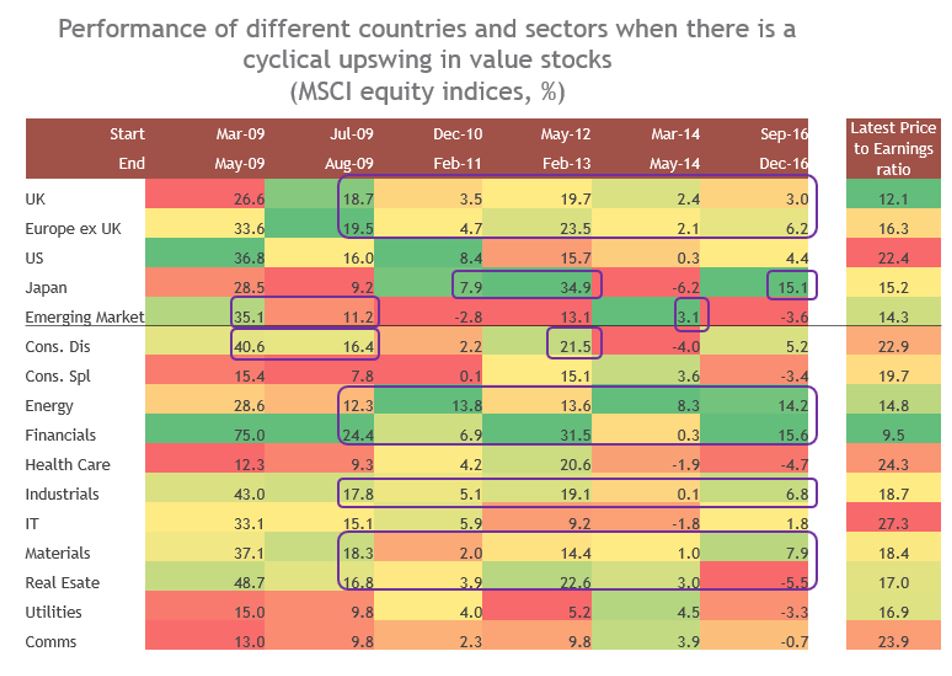
Source: Datastream, as at 31 May 2020
To conclude, given the right macroeconomic conditions, cyclical bounce in value vs growth could emerge. Since the global financial crisis, 4 factors have emerged as the driving force behind the outperformance of growth stocks. The recent coronavirus sell-off has left this split at its most extreme, both from a performance and valuations perspective. Although we note a structural trend away from value, since 2008, metrics still look pushed. In a V-shaped recovery situation, economies are set to reopen, bolstering the manufacturing PMI and improving oil prices. We also see the possibility of a weakening dollar and higher inflation. Given these factors retain their influence, their macro outlooks should provide a supportive backdrop for a value rebound. With the possibility of value outperforming growth by 15% year on year, investment opportunities arise. Historically, a growth to value rotation has benefitted the UK at the expense of the US, whilst the energy and financial sectors achieve relatively attractive returns. If a rotation from growth to value is emerge, history suggests that it will short, sharp but sweet for those in those in the right place.
Please remember investment involves risk. The value of investments and the income from them can fall as well as rise and investors may not receive back the original amount invested. Past performance is not a guide to future performance.
DISCLAIMER
By necessity, this briefing can only provide a short overview and it is essential to seek professional advice before applying the contents of this article. This briefing does not constitute advice nor a recommendation relating to the acquisition or disposal of investments. No responsibility can be taken for any loss arising from action taken or refrained from on the basis of this publication. Details correct at time of writing.
Evelyn Partners Investment Management LLP
Authorised and regulated by the Financial Conduct Authority.
Registered in England No. OC 369632. FRN: 580531
Evelyn Partners Investment Management LLP is part of the Evelyn Partners group.
© Evelyn Partners Group Limited 2021
Ref: 82620lw

