
- Wealthiest 10% of households have seen overall inflation of 64% since 1997, compared to 50.7% for typical households and 53.8% for lowest income families
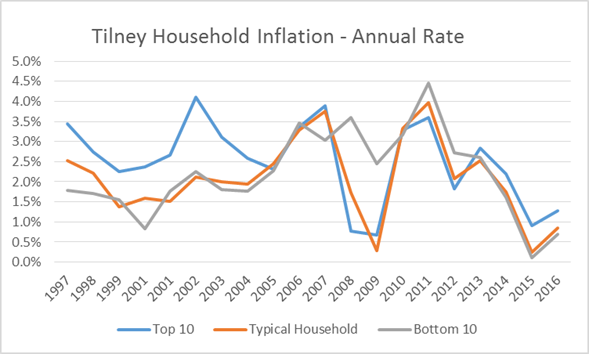
- A game of two halves over the last two decades; inflation hit wealthiest households hardest pre-recession, but impacted lower income households most since 2007/8
- Each household experiences inflation differently - wealthier households devote proportionally more spend to education, holidays and buying homes, all of which have risen dramatically in cost in the last 20 years
- Tilney’s data analysis mirrors the 20-year period over which the Bank of England has been granted independence in setting interest rates as a tool for controlling inflation
- Experts warn the extent to which mis-calculating inflationary impact can have on standards of living and future proofing finances
The top 10% of UK households (by income) have had to work harder to maintain their standard of living, having experienced a much higher rate of inflation than the rest of the population over the last 20 years, according to a new report, The Household Inflation Index, from financial planning and investment management group Tilney. Tilney’s analysis of Office of National Statistics (ONS) data, dating back to 1997, found that households with an income of over £78,500 per year – the top 10% - have seen overall inflation of 64.0%, while the typical income household (£26,900 – £30,000 p.a.) has seen inflation of 50.7%, and the bottom 10% (less than £10,400), 53.8%.
Each household experiences its own rate of inflation
Inflation is calculated by looking at the changing prices of items in an average household’s basket of goods. In reality though, households spend their money in different ways and each has its own individual rate of inflation as a result. Tilney’s analysis shows that the biggest single factor, unsurprisingly, is housing across all groups, but disproportionate spending on education, holidays and buying homes, where prices have risen fastest, combined with lower spending proportionately on essentials such as food and drink, has meant wealthier households have experienced the greatest inflation overall during the last 20 years.

A game of two halves, pre and post-recession
The spending mix of households has meant inflation has been a game of two halves over the last 20 years. Pre-recession, soaring house prices contributed to the top 10% experiencing by far the highest rate of inflation. Post-recession, while the top 10% benefitted from a brief drop-off in house prices from 2007-2009, lower income households became the hardest hit, due to the rising cost of utilities and food, which they spend more on proportionally than typical or wealthier households.
The launch of Tilney’s report coincides with the 20th anniversary of the Bank of England being granted autonomy to dictate interest rates as a tool for controlling inflation. While the typical household has, in an average year, experienced an annual rate of inflation of 2%, the Bank of England’s target rate, the wealthiest tenth have seen a variance of 0.5% higher per year. Analysing the macro-economic and political events that have happened during the last two decades, the impact on prices, and ultimately on household income, should be a key informant to the financial planning process if consumers are to protect their standard of living from the long-term effects of inflation personal to their household.
Andy Cowan, Head of Financial Planning at Tilney said: “With economic and political uncertainty likely to be a dominant theme in the coming years, astute financial planning is more important than ever. In this planning process, it’s widely understood that holding too much cash for long-periods of time is a sure way to see the real value of wealth eroded and that any investments must produce inflation-beating returns, to make them worthwhile. What fewer people appreciate, however, is that all households experience their own individual rate of inflation and this can vary greatly depending on how the household budget is spent.
“Those with children in private school will experience a vastly higher rate of inflation, as private school fees have soared four-fold in the last 20 years and show little sign of slowing. In this sense, it’s vital that households plan for a level of inflation that’s appropriate to them.
“To give an example, take someone in the top 10% of UK households by income, investing £100,000 over a 20-year period, with the aim of generating a return of 3% (net of inflation). If this household was to plan for the UK average inflation rate of 2%, rather than the 2.5% experienced by the top 10%, they would miss their saving target by £16,749.48. This emphasises just how important it is to plan properly for inflation, by considering what exactly you spend your money on and how this could be affected by rising prices in the future. The last 20 years offer a useful guide to help with this.”
To view the report in full, please click here
Disclaimer
This release was previously published on Tilney Smith & Williamson prior to the launch of Evelyn Partners.